Breakpoint Debugging
It takes to you high speed by using ES2015+ in Node.js project. Because of some feature's lack, we need use Babel to compile our codes and run compiled code. It's terrible that debug will return code position in compiled file while I really want to know code position in source file.
The good news is that ThinkJS has been support breakpoint debug source code after 2.2.0 version. That means ThinkJS will tell you the exactly code position in source file when you have error.
Breakpoint debugging with node-inspector
Install node-inspector
You can global install node-inspector by typing command npm install -g node-inspector. Sometimes you should use sudo in *unix system.
Start node-inspector service
Start node-inspector service by using node-inspector &.
Start Node.js service
Start Node.js service by using node --debug www/production.js.
What difference is --debug parameter than before. npm start command has no this parameter so we can't use it.
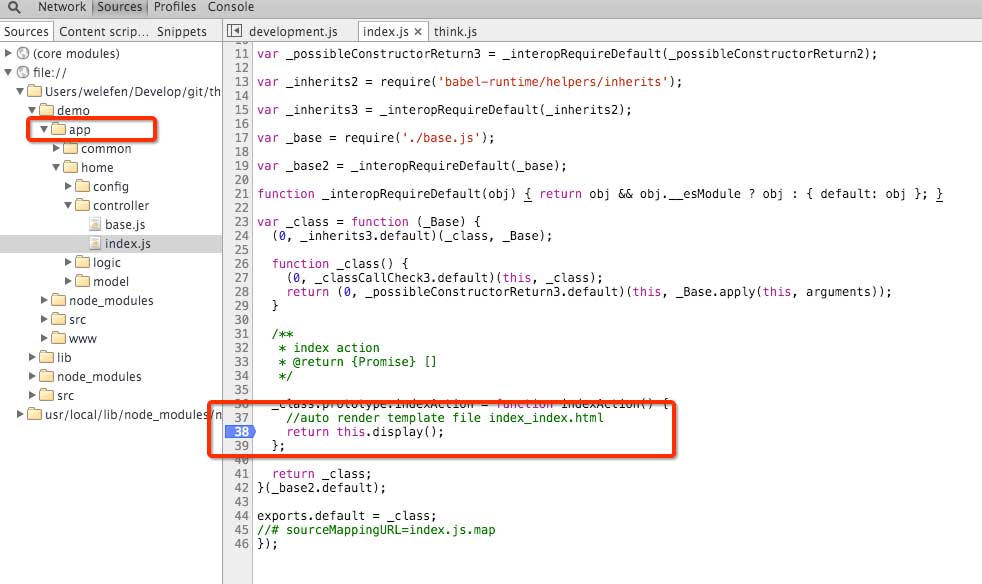
Debug
Visit http://127.0.0.1:8080/debug?port=5858, it will display debugging page.
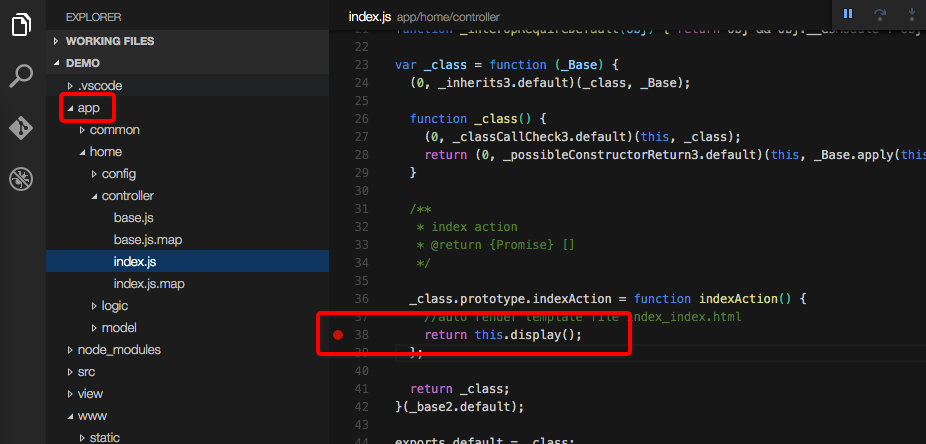
Then find compiled file in app folder, insert breakpoint in position you want. It's important that insert in app folder not in src source folder.
Open new tab and visit url you want debug. At this time page will be blocked, and come back to node-inspector page, you will see debug position has skiped to source file.
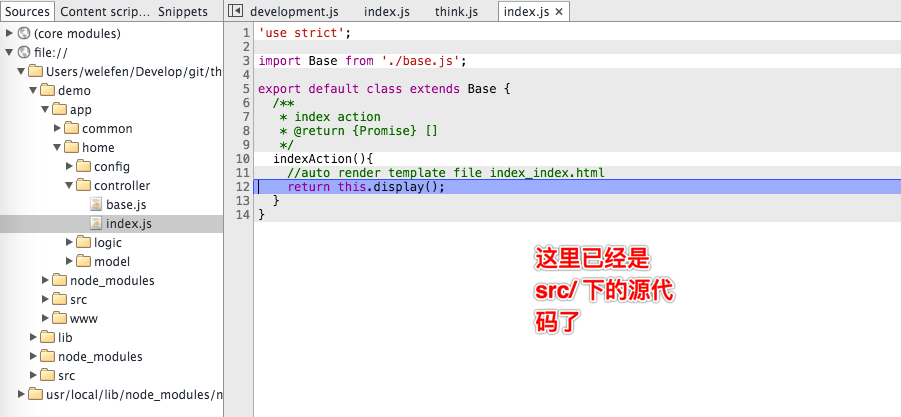
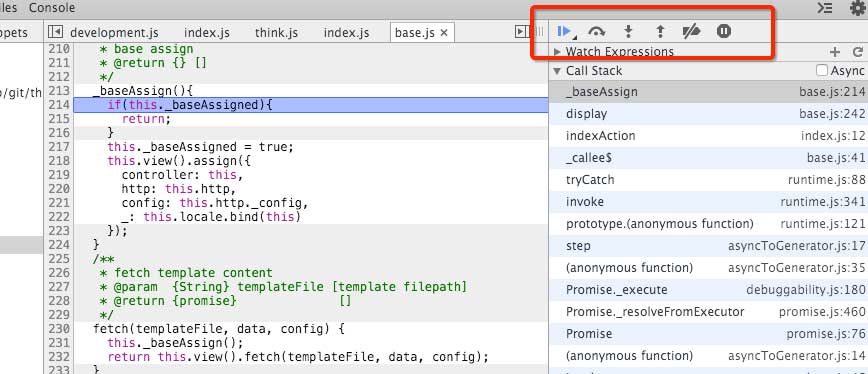
Then you can use this tools to debug.
Breakpoint debugging in VS Code
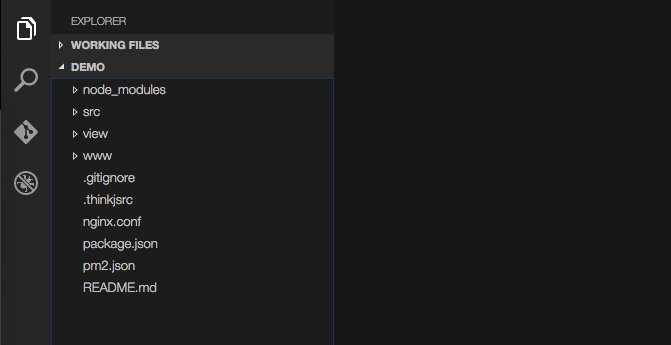
Open Project
click menu File - Open to open ThinkJS project, like:
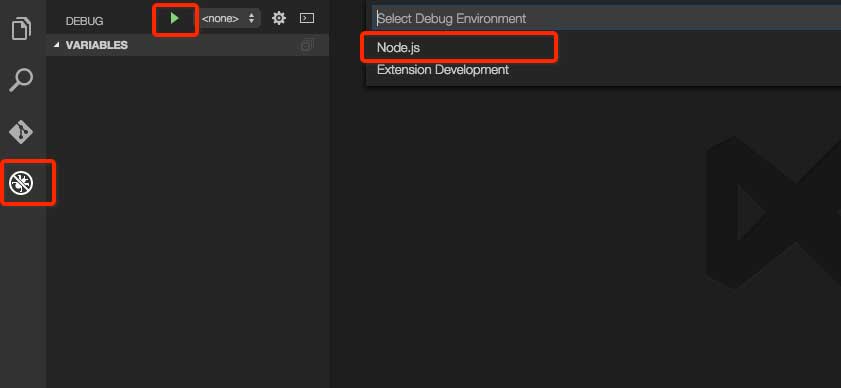
Setting debug
Click debug menu on the left and debug button on menu. It will make you choose environment, and we choose Node.js.
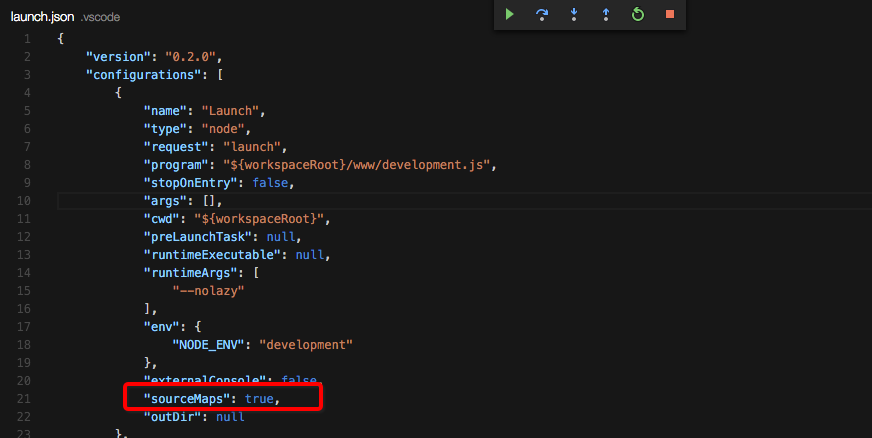
After that, launch.json will be created in project. Modify all sourceMaps value to true in this file.
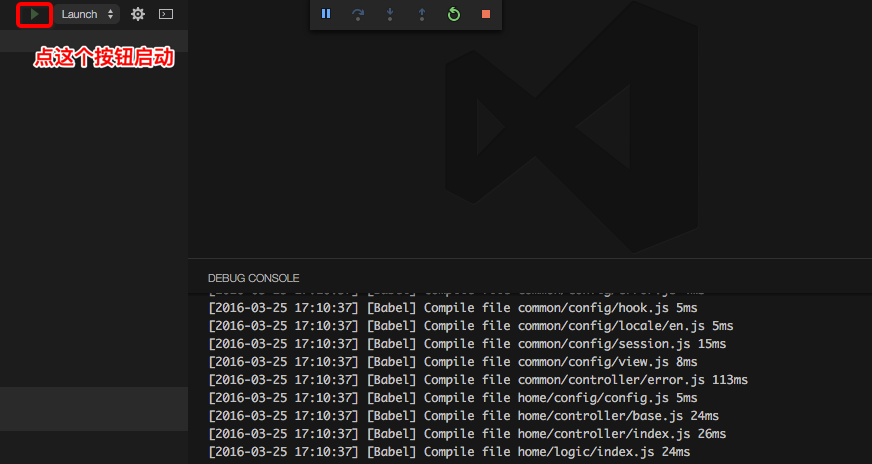
Start service
Click debug button to start service. If you have boot Node.js service, you need close it to avoid error of port using.
Start debug
Back to code view and insert breakpoint in app folder. It's important that insert in app folder not in src source folder.
Visit url you want debug, and we can use debug button to debug on the top.
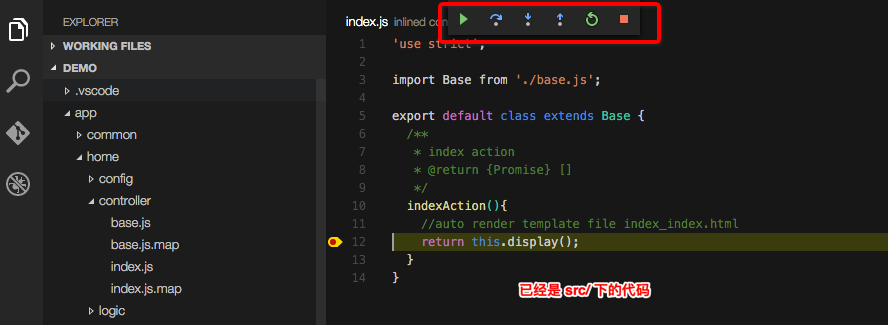
That's all for debuging ES2015+ in VS Code.
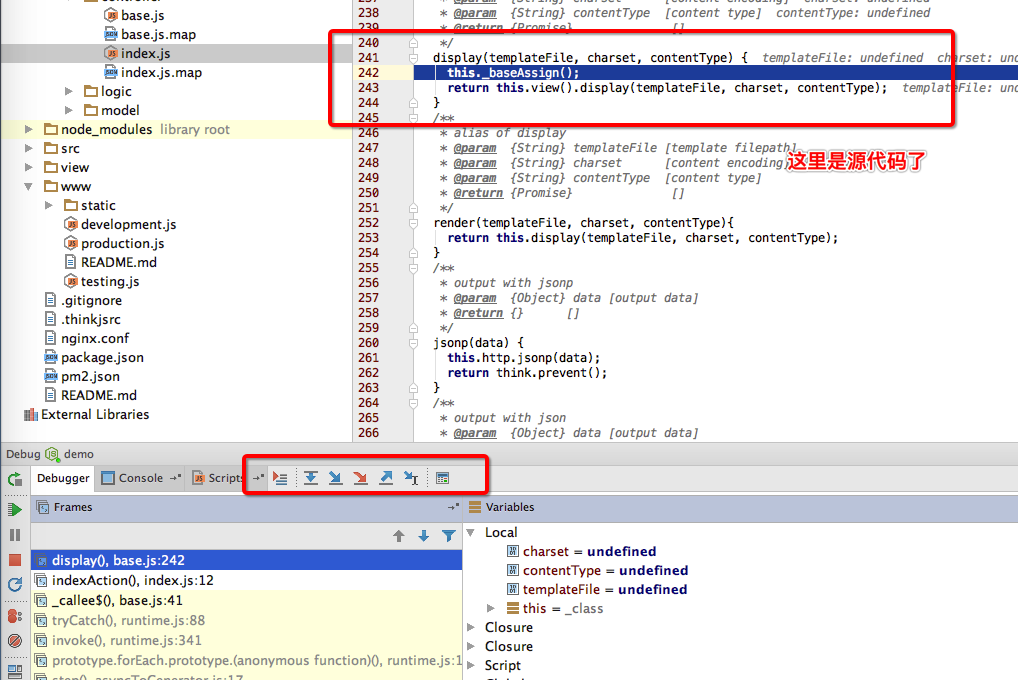
Breakpoint debuging in WebStorm
Cofigure WebStorm
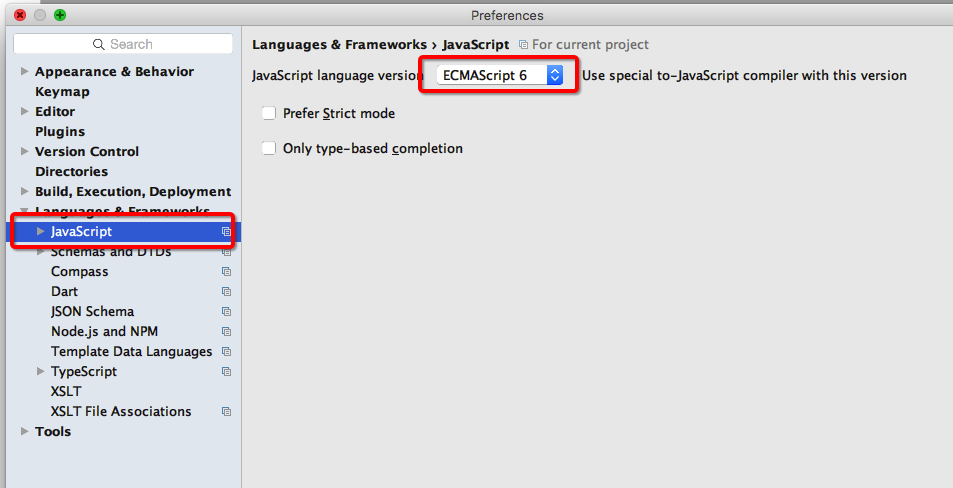
Import ThinkJS project into WebStorm and modify JavaScript version to ECMASCRIPT 6 in preference.
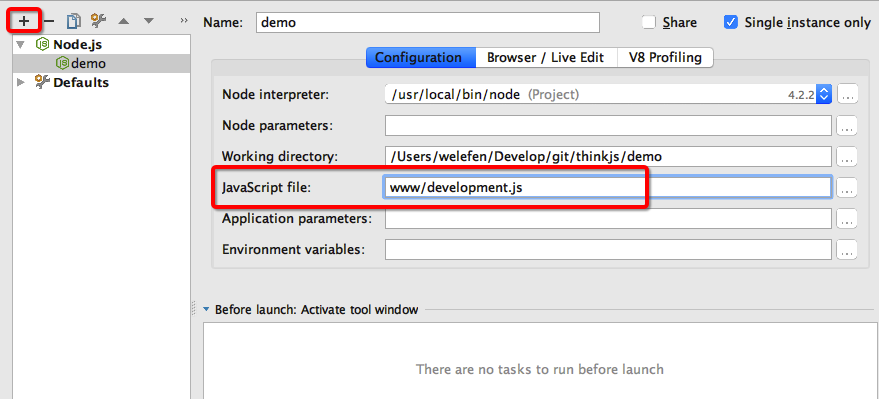
Click Edit Configurations and then create a new project and set project type to Node.js.
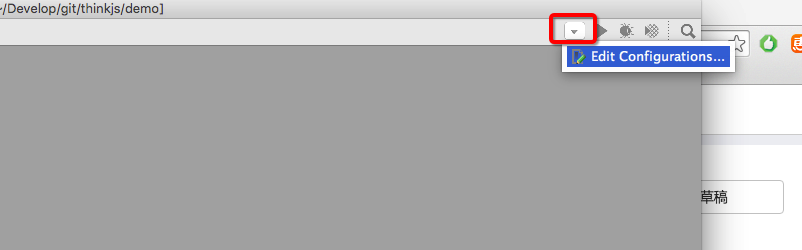
Insert www/development.js into JavaScript File on the right, or choose right file by using button.
Debug
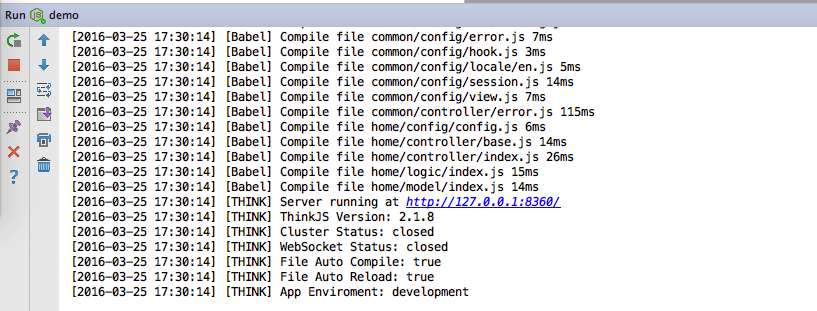
Click debug button will open Node.js service.
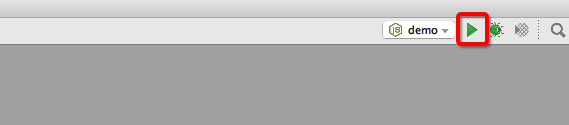
If you have boot Node.js service, you need close it to avoid error of port using.
Insert breakpoint in app folder. It's important that insert in app folder not in src source folder.
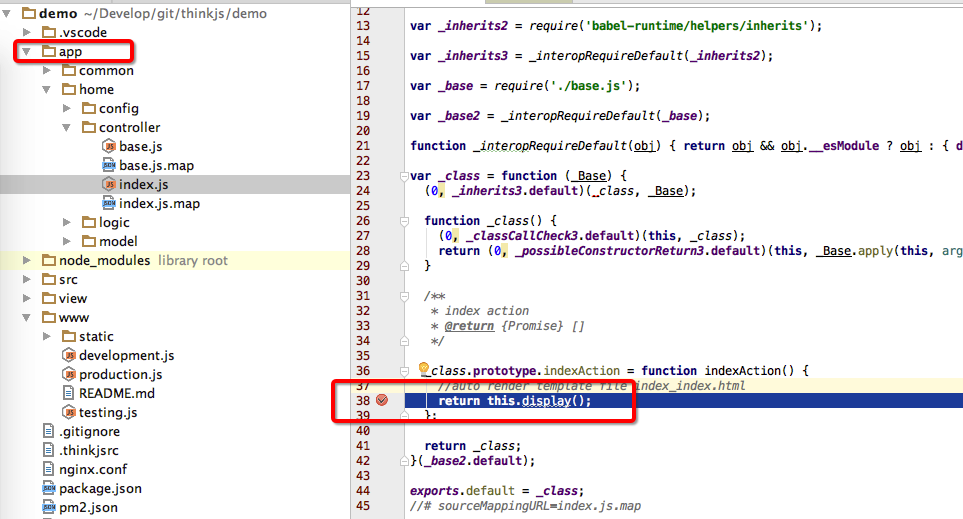
Open browser and visit url you want debug. Back to WebStorm and click debug button to start debug in source code.